The topic of airline pricing never gets old. The last 12 months has brought numerous changes to the airline scene, from Norwegian Air’s new star status to British Airway’s recent foray into the budget scene. You can now research your flights screen-free through Amazon Alexa or Google Home as airlines jump into the AI space. And the gap between the front and the back of the plane is ever-growing, with major airlines rolling out a ‘basic economy’ class (that we think is closer to cattle class) and adding fees on everything from luggage to seat assignments. What’s certain is that getting from A to B has never been so full of choice, confusion and chaos – and comparing flight prices has never been more difficult.
To better understand the value for customers offered by the world’s airlines, we’ve gone back to what we love most: hard data. Just like in our oh-so-popular reports from 2012 and 2016, our data scientist team analysed economy-class airfares displayed by Rome2Rio over a two month period, totalling some 1.5 million price points, to provide a snapshot of global pricing (in US$ per km) across international and domestic carriers. We wanted to get a sense of the world’s most affordable airlines, and the cheapest – and most expensive – countries to travel in right now. For the full details of the analysis, see here.
The results are fascinating. Of course, airfares follow certain trends; longer flights cost more, and some airlines are more expensive per km flown than others. However, there’s always more to the story than this. There are many factors which can influence per km costs, including the type of aircraft flown, routes flown, local salary and fuel costs, ancillary revenue and airport landing fees.
Since our 2016 report, we have seen minor shifts in pricing and ranking. In general, the low end of both the international and domestic rankings have shifted up in cost per km. With reports of flight prices headed upwards, largely due to increased fuel costs, this may unfortunately be a trend that continues.
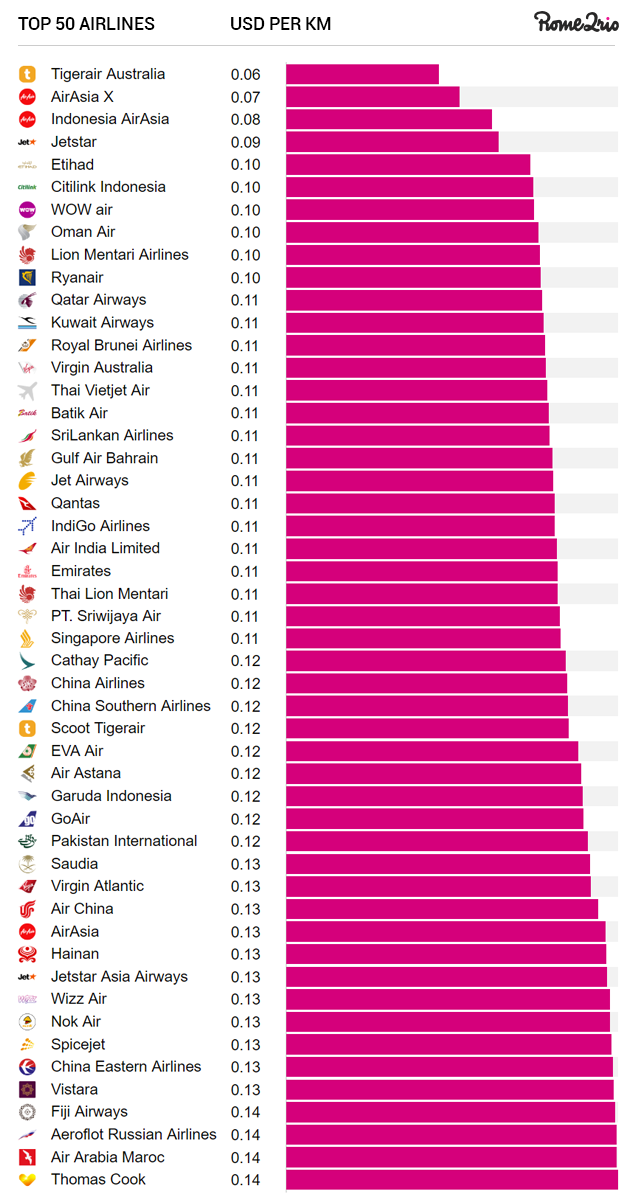
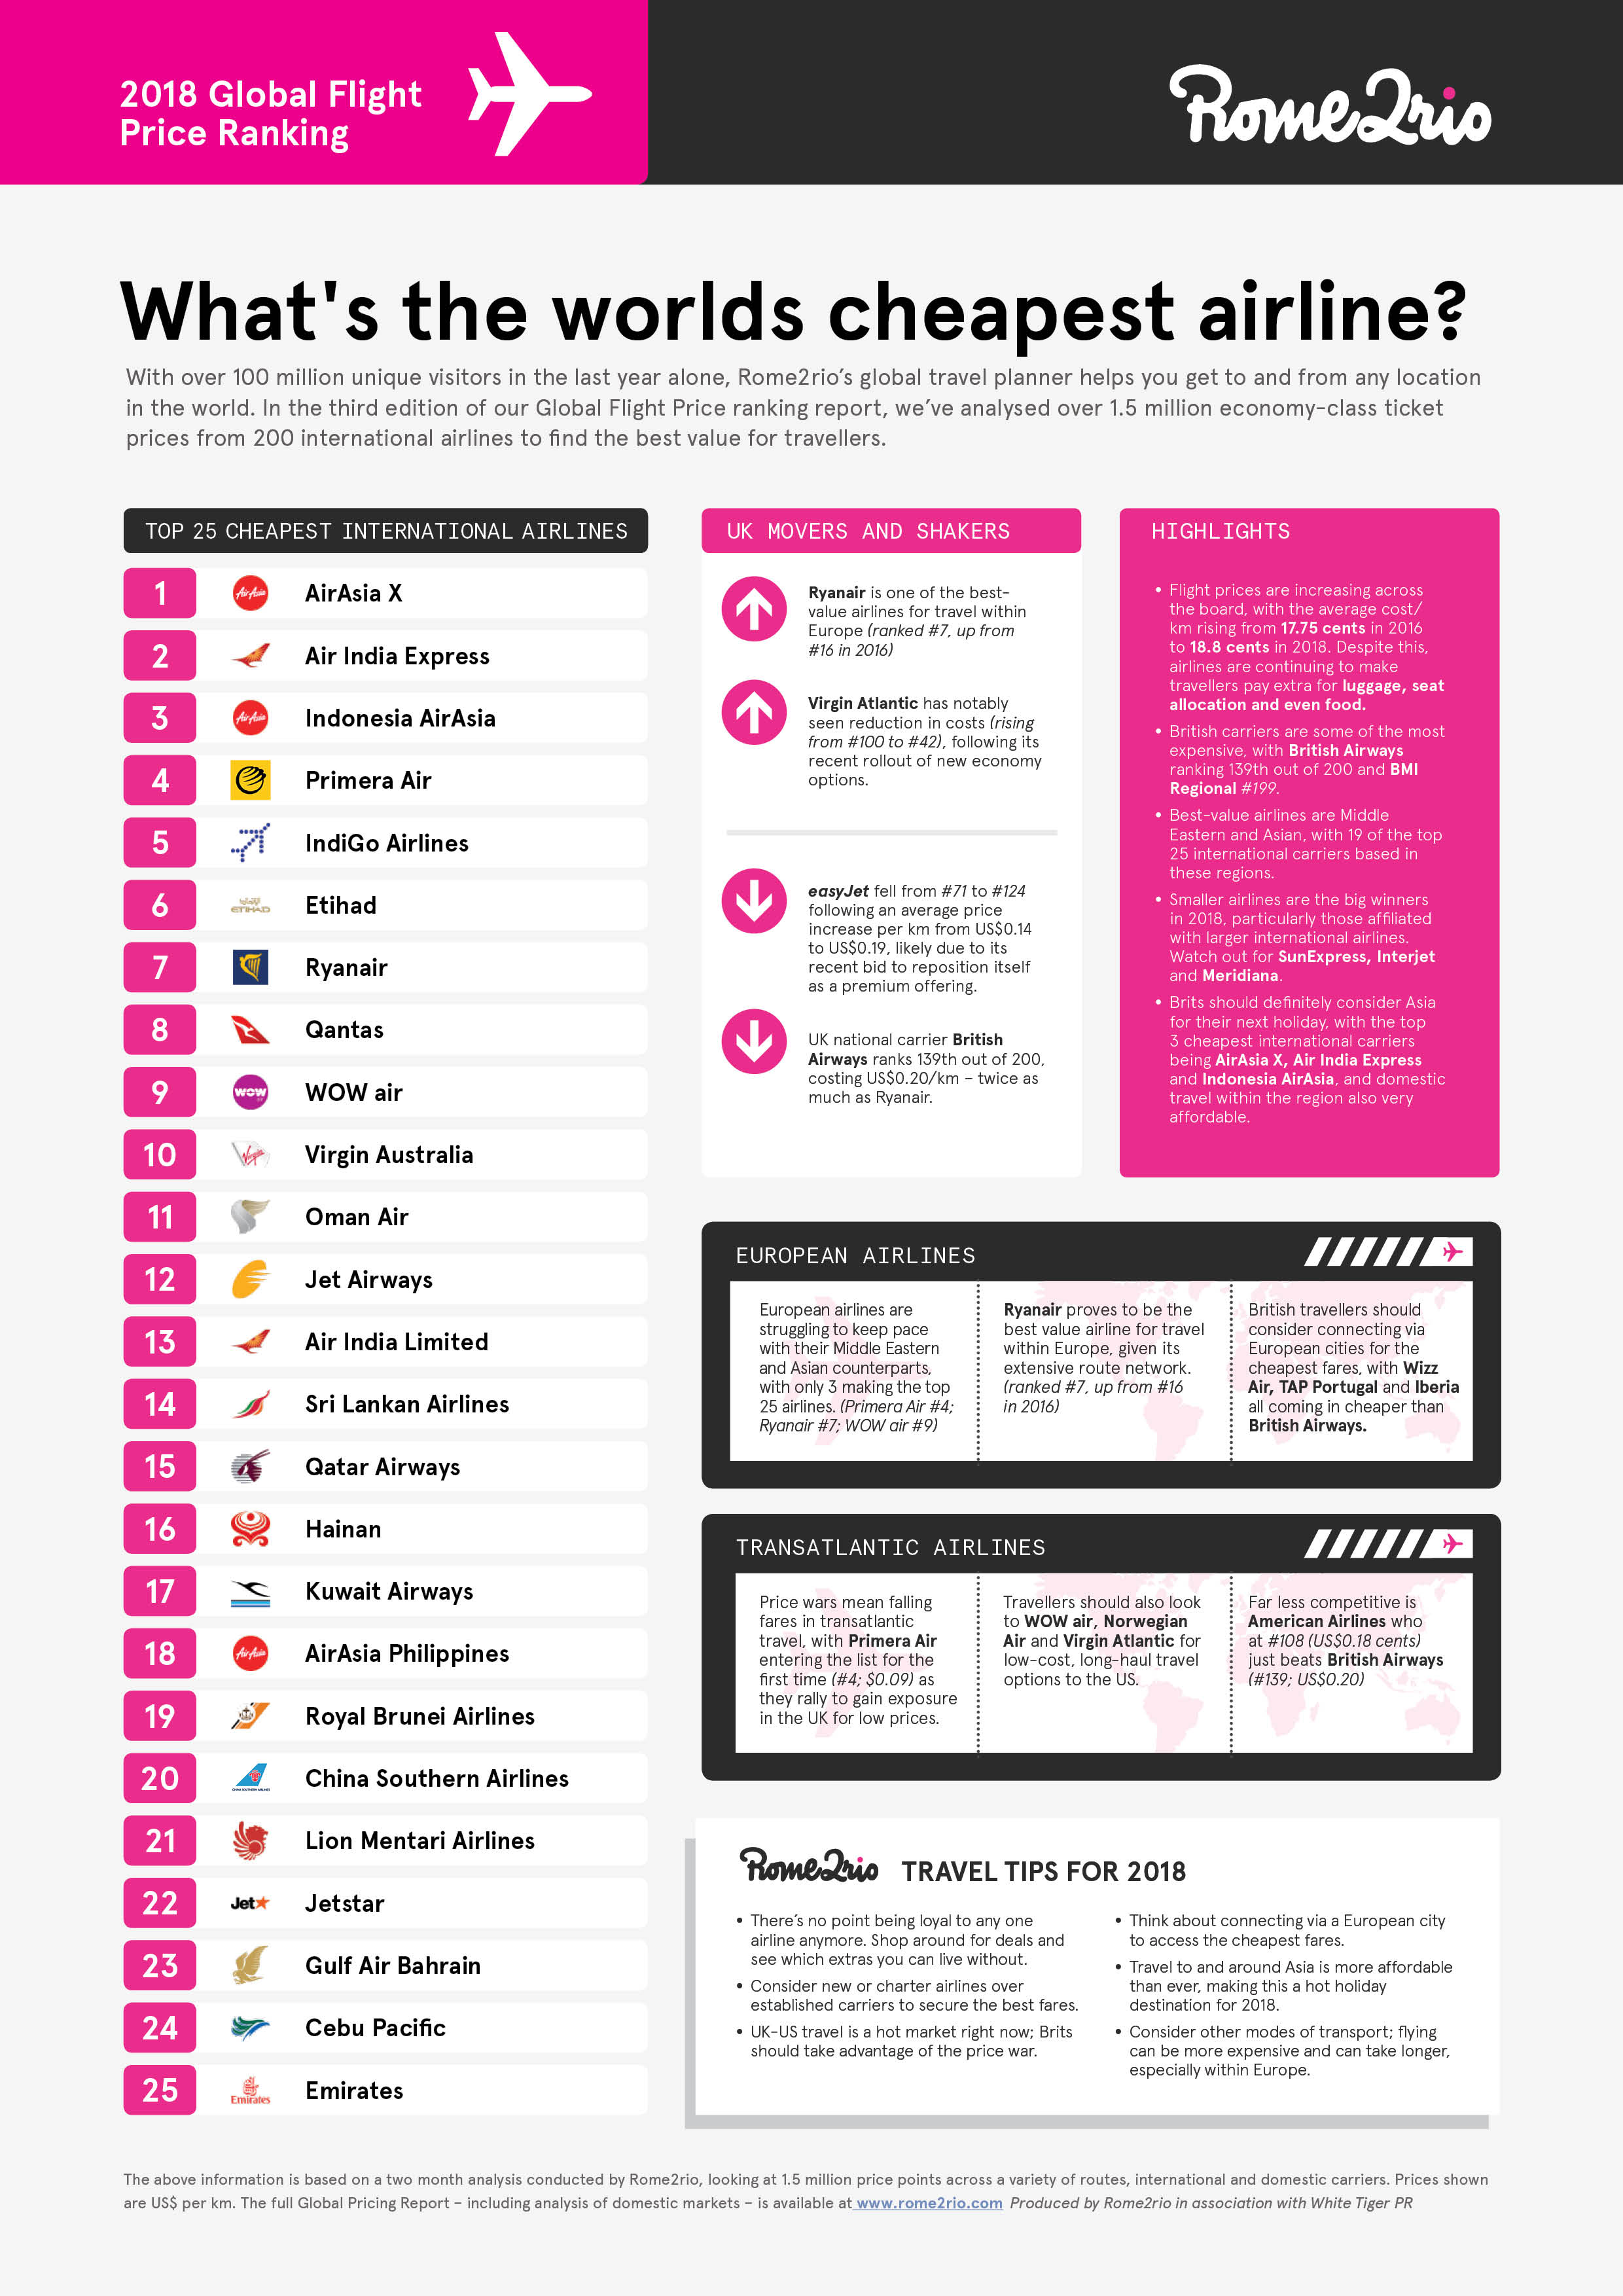
The main standout is that Scoot is no longer one of the cheapest carriers, dropping dramatically in our international rankings (from #1 in 2016 to #31 in 2018), with the average price per km jumping from US$0.07 to US$0.12. This may be due to the Tiger/Scoot merge in 2017 and the separation off of the Tiger brand in Australia, which now exists under different ownership. However, travellers to and around Asia still have plenty of cheap options to choose from, with AirAsiaX, Air India Express and Indonesia AirAsia coming in at #1, #2 and #3 to take you the furthest for your dollar.
Other international standouts include Primera Air (#4 in the international rankings), a relatively new player in the low-cost, long-haul revolution. Mainly flying between Scandinavia and European holiday destinations, the airline has started branching out into low-cost flights from Europe to North America. WOW, another competitor on this low-cost Atlantic route, also ranks high (#7 overall) – but the third kid on this block, Norwegian Air, who had a booming 2017 with headline-grabbing fares, is way down the list at almost twice the cost/km as Primera. Whatever the reason, this battle for supremacy of the skies between Europe and the US looks to play out for a while longer, with seriously cheap tickets up for grabs. Just remember to bring your own food!
For European travellers, Ryanair (unsurprisingly) also comes high in the list, with a per km cost of US$0.10, which is comparable to some of the budget Asian carriers. The short-haul airline, which dominates the European market and has an aggressive focus on cheap fares, has made headlines in recent years with its novel – and sometimes radical – takes on cost-cutting. Easyjet, Europe’s other main budget carrier, interestingly comes in substantially higher (at US$0.19/km) – and Southwest, the US’ main budget carrier, is almost three times the cost per km of Ryanair, at US$0.29/km, showing that the meaning of ‘budget’ can vary widely on different sides of the pond.
The trifecta of Middle Eastern carriers, Etihad, Qatar and Emirates, continues to rank highly. But travellers should also look to Oman Air, Kuwait Air, Royal Brunei Airlines and Gulf Air Bahrain, all of whom also have extensive route and destination offerings and come in at the same or similar competitive cost/km.
But what’s the world’s cheapest airline? Drum roll… Chile wins the award for the country with the cheapest average prices (with Nepal coming in at the highest), but it’s Australia’s Tiger Air that sweeps the floor with its US$0.06/km cost, likely due to the large distances covered by the budget airline. Not only that, but following years of bad press (it was voted Australia’s worst airline three years in a row), it was bought by Virgin in 2014 who seem to have turned its fortunes around. It’s not often we say this, but sometimes cheapest can be best!
Rome2Rio’s 2018 Global Flight Price Ranking infographic showing the world’s cheapest airlines
About the ranking
We based our airline price comparison on economy-class airfares displayed by Rome2Rio in January and February 2018. Rome2Rio serves millions of visitors per month with a global user base spanning Europe, Americas and Asia Pacific, so our pricing data covers hundreds of airlines and millions of tickets. We only studied economy fares. Airlines sometimes offer highly non-competitive fares for shopping queries, so for this analysis we included only fares that fell within two times the cheapest price available for each shopping query.
As with previous entries in this series, our analysis is intended to be a conversation starter, not a definitive statement on pricing trends or a given airline’s place in any particular pecking order. The cost of a flight depends on many factors, including how close the booking is made to the time of travel and the popularity of the route.
Written by Ellie Cobb with data analysis by Richard Fothergill.
Rome2Rio is organising the world's transport information. We offer a multi-modal, door-to-door travel search engine that returns itineraries for air, train, coach, ferry, mass transit and driving options to and from any location, utilising a purpose built repository of route, frequency and pricing information for some 750,000 routes from over 4,800 operators in 144 countries. Rome2Rio is based in Melbourne, Australia.